Statistical Tests on Tables
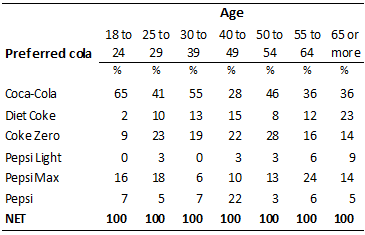
Consider the following table which shows the relationship between preference for different brands of cola and age. Which cells on this table are worth examining more closely? The first answer to this question is that we should look at any cells that relate to existing hypotheses. However, more often than not, we have no hypotheses. This is where statistical testing can help. It can identify tables that may contain interesting results.
There are two different approaches to performing significance testing on tables with the goal of helping data exploration: column comparisons and cell comparisons.
Column comparisons
As shown in the first row of the table above, 65% of people aged 18 to 24 preferred Coca-Cola, compared to 41% of people aged 25 to 29, 55% of people aged 30 to 39, etc. One approach to conducting significance tests on this table is, for each row, to compare the percentages all possible pairs of columns. That is, test to see if the 18 to 24 year olds preference to Coca-Cola is different to the preference of people aged 25 to 29, is different to the people aged 30 to 39, and so on.
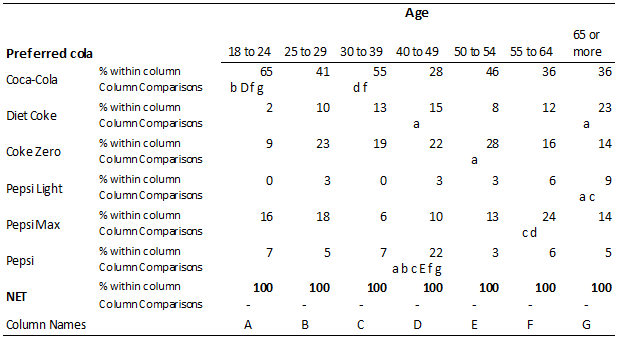
The table below shows P-Values computed between each of the columns' percentages in the first row. The p-values are bold where they are less than or equal to the significance level cut-off of 0.05. Each column's age category has been assigned a letter and the significant pairs of columns are: A-B, A-D, A-F, A-G, C-D and C-F. If we use greater than and less than signs to indicate which values are higher, we have: A>B, A>D, A>F, A>G, C>D and C>F.
| 18 to 24 | A | |||||||
| 25 to 29 | B | .0260 | ||||||
| 30 to 39 | C | .2895 | .1511 | |||||
| 40 to 49 | D | .0002 | .2062 | .0020 | ||||
| 50 to 54 | E | .0793 | .6424 | .3615 | .0763 | |||
| 55 to 64 | F | .0043 | .6295 | .0358 | .4118 | .3300 | ||
| 65 or more | G | .0250 | .7199 | .1178 | .5089 | .4516 | .9767 | |
| A | B | C | D | E | F | G | ||
| 18 to 24 | 25 to 29 | 30 to 39 | 40 to 49 | 50 to 54 | 55 to 64 | 65 or more |
Although the six pairs are all significant at the 0.05 level, some have much lower p-values than others. If we use upper-case letters to indicate results significant at the 0.05 level and lower-case to indicate results significant at the 0.001 level we get: a>b, A>D, a>f, a>g, c>d and c>f. (Often commercial studies use upper-case for significant at the 0.05 level and lower case for significant at the 0.10 level.)
The table below places the letters indicating significance onto the table. Letters are only shown beneath the higher of the comparisons. Thus, only the 18 to 24 and 30 to 39 categories have letters for Coca-Cola. Tests have been shown for all the rows on the table.
Also known as
This approach is sometimes referred to as pairwise comparisons, post hoc testing and multiple comparisons.
Cell comparisons
An alternative approach to testing is to compare each cell with the combined data from the other cells in the rows. For example, we can compare the 65% preference of Coca-Cola by 18 to 24 year olds with the preference of all the people in the other age groups. The table below shows the some data as above but with the unweight counts shown on each table (labeled as n). We can compute the preference for Coca-Cola amongst the people not aged 18 to 24 is (16+38+17+18+18+8)/(39+69+60+39+50+22)=42%. A significance test computes the p-value of 65% versus 42% as being 0.0001. In the same way, we can compare each of the age categories with the combined results from the other age categories. The table below shows the resulting p-values of the seven significance tests.
| 18 to 24 | 25 to 29 | 30 to 39 | 40 to 49 | 50 to 54 | 55 to 64 | 55 to 64 | |
| Compared to combined other categories | .0033 | .6500 | .0443 | .0055 | .8151 | .1928 | .4313 |
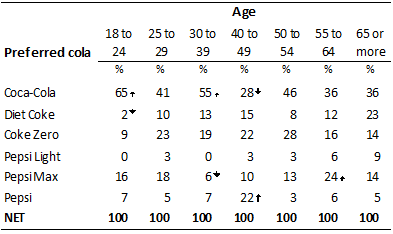
The table below shows the significance tests for all the cells in the table. Arrows are used to indicate results significant at the 0.05 level. The length of the arrows is determined by the p-value. Smaller p-values are represented by longer arrows. In contrast to the column comparisons shown above, this approach to representing significance is a little easier to read as the arrows provide visual cues which highlight the nature of the patterns in the data and thus draws the reader's attention to exceptions.
Also known as
There is no standard name for this approach to showing statistical significance. Although it is referred to as cell comparisons in this site, it is also sometimes described as residuals analysis and exception reporting (both of these terms have other meanings as well).
The relative strengths and weaknesses of column comparisons versus cell comparisons
| Advantages of column comparisons | Advantages of cell comparisons |
|---|---|
|
|


