Category:MaxDiff
This page contains links to MaxDiff resources. The main sections of the page lists the key resources and concepts. The bottom of the page contains additional resources listed in alphabetical order.
What is MaxDiff?
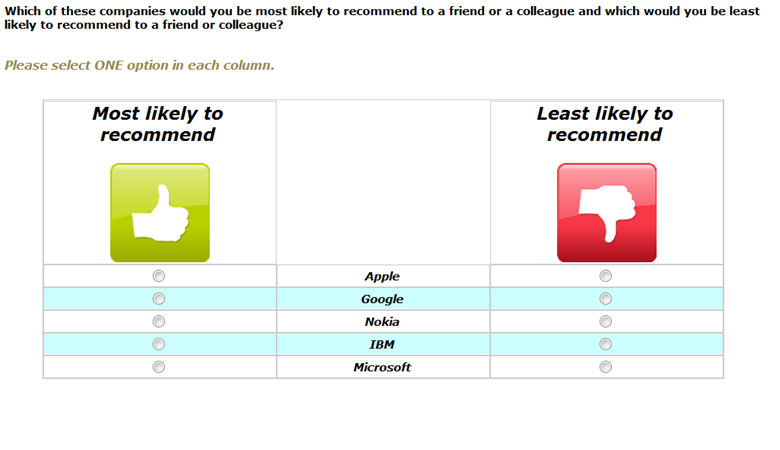
MaxDiff is a type of survey questioning approach in which respondents are presented with lists of items and are asked to indicate which in each list they like the most and which they like the least. It is also known as best-worst scaling, max diff, max-diff, maximum difference scaling, and Max Differential Scale Data. An example of a MaxDiff question is shown below. Typically respondents are asked to complete multiple similar tasks, where the options shown in each task varies according to an experimental design.
If you are new to MaxDiff, please read A Beginner’s Guide to MaxDiff for an overview.
The following video illustrates all the key aspects of MaxDiff. It uses Q to perform the demonstration (if you are using Displayr, the menus are different, but all other aspects of standard MaxDiff analyses are identical between the apps. The data and slides used in the video are here.
MaxDiff is run in Displayr by selecting from within the MaxDiff sub-menu (i.e., Anything > Advanced Analysis > MaxDiff) and then picking the type of model you want to run.
Experimental design
Standard MaxDiff experimental designs are created by selecting Experimental Design from within the MaxDiff submenu. See How to Create a MaxDiff Experimental Design in Q and How to Create a MaxDiff Experimental Design in Displayr for more information about creating standard designs. For a discussion of more advanced designs, see Advanced MaxDiff Experimental Designs.
Once the design has been created it should be checked. This is discussed in the links above, and also in How to Check an Experimental Design.
Setting up an experimental design for analysis
There are many methods of creating MaxDiff designs. However, the design needs to be set up in a small number of special ways in order to analyze it in Q or Displayr.
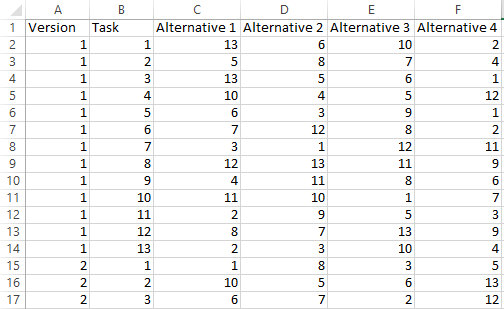
- Column 1 should be called Version, and it should tell us which version of the experiment each row corresponds to. If you have a single version of the experiment, then this column should simply contain the number '1' in each row. If there are multiple versions, then this column should contain integers starting at 1 and ranging up to the total number of versions you have included. These should be in blocks, so that all rows for version number 1 appear together, followed by all rows for version number 2, and so on.
- Column 2 should be called Task or Question, and it should contain a number that tells us which task within the experiment each row corresponds to. If there are 6 tasks shown to each respondent, then this column should contain numbers 1 to 6, in order. These should be repeated for each task, so that the rows for version number 2 begin again at 1.
- The remaining columns are for the alternatives shown. If there are 5 alternatives shown to each respondent in each task, then you should have 5 columns here. The numbers in these columns indicate which of the total set of alternatives are shown in each alternative of each task. The names of these columns will not affect the analysis.
- There should be no hidden rows and no extraneous rows or columns.
Depending on how you have created the design, it is likely in a CSV file or XLSX file, in a Q Project or a Displayr document.
Example of an experimental design in Excel
You can download example files from the Q Wiki. The following screenshot shows a file where there are at least 2 versions, 13 tasks (i.e., questions) per version, 4 alternatives per task, and 13 alternatives.
Example experimental design in Displayr or Q
The following is an example of an experimental design which has 2 versions, 6 tasks, and 5 alternatives for each task:
Getting the experimental design into Displayr and/or Q
The experimental design needs to be set up as an R Output in order for it to be used in standard analyses (defined below). Where the design has been created in Displayr or Q, it will already be in this format. If your design is in a CSV file or Excel file, you can import this into an R Output as follows:
- Import it as a new Data Set. In the Data Sets tree click the + or + Add Data Set.
- Create a Calculation containing the data. The easiest way to do this in Displayr is using Anything > Table > Raw Data > Variable(s) and select the variables.
Setting up a data file for MaxDiff analysis
Different analyses methods require different data file setups. Most of the time, the approach described for standard analyses is appropriate (if this is your first study, start with this).
Standard analyses
If performing a standard analysis, which includes all the analyses in the MaxDiff sub-menus in Displayr and Q, the data file needs to be set up as follows:
- It needs to be a data file with good quality metadata (e.g., SPSS .SAV, Triple-S, MDD, or, a data file set up in R with factors).
- One variable needs to indicate the version (if versions have been used in the experimental design). This variable would simply contain a number for each person. The numbers should begin at '1' and range up to the number of versions that are present in the design.
- Each of the 'best' or 'most preferred' questions and each of the 'worst' or 'least preferred' questions needs to be represented by its own variable, where the variable needs to be either Categorical or Pick One (Q), Nominal (SPSS, Displayr), or a factor (R), with labels containing the wordings of the alternative that were selected. Ideally, the Value Attributes should be consistent across these variables. For example, if 'Price' is the third alternative in the experimental design, then each variable containing the respondents choices should have a value of 3 if 'Price' is chosen, regardless of what other alternatives were available in that question (i.e., 'Price' should not be stored as a 3 in one variable and a 4 in another). When selecting these variables in the Object Inspector for the analysis, they should be selected in the same order as the design (e.g. the variable for the first task should appear first in the selection, followed by the variable for the second task, and so on).
Some of the MaxDiff analysis routines will be tolerant if you get some of this wrong, but you should check things carefully.
You can download example files from the Q Wiki.
More exotic analyses in Q and Displayr
More exotic analyses in Q and Displayr (described below), require the MaxDiff experiment to be set up as a Ranking. See Setting Up a MaxDiff Experiment as a Ranking for more information.
More exotic analyses in R
MaxDiff can be analyzed using software designed for choice modeling. See Analyzing MaxDiff Using Standard Logit Models Using R for a discussion of how to analyze MaxDiff experiments using standard choice modeling software.
Analysis
How MaxDiff Analysis Works (Simplish, but not for Dummies) provides an overview of the analysis of MaxDiff analysis, focusing on the more 'standard' types of analysis.
Standard analyses
An overview of the standard analyses of MaxDiff data are described in How to Analyze MaxDiff Data in Displayr and How to Analyze MaxDiff Data in Q. The main methods, which are described in more detail on the Q Wiki, are:
More exotic analyses in Displayr and Q
- The general-purpose Latent Class Analysis tool in Q and Displayr can be used can be used to analyze MaxDiff data. In general, there is little point in doing this, as it is easier to use the standard analyses (which also use latent class analysis, but are designed specifically for MaxDiff data). However, if the desire is to form segments using multiple types of data (e.g., MaxDiff and ratings scale data), this can be done using Latent Class Analysis.
- Mixed-Mode Trees can be created using a MaxDiff experiment as the outcome.
Respondent-level data
Typically it is useful to estimate information for each respondent in a MaxDiff experiment. This is variously known as respondent-level or individual-level analysis (there is no widely used standard name).
Standard analyses in Displayr or Q
If you have used one of the standard analyses in Displayr or Q, you can extract variables by selecting your MaxDiff analysis, and selecting the following options from the MaxDiff sub-menu:
- Save Variables > Class Membership Probabilities
- Save Variables > Compute Preference Shares
- Save Variables > Compute Sawtooth-Style Preference Shares (K Alternatives)
- Save Variables > Compute Zero-Centered Utilities
- Save Variables > Individual-level Coefficients
- Save Variables > Membership
- Save Variables > Proportion Correct
Exotic analyses in Q
See the MaxDiff Case Study in Q for more information about computing respondent-level information using MaxDiff in Q.
Exotic analyses in R
Often the key variables can be extracted using fitted or predicted functions, but there is no widely-recognized standard, so consulting the documentation of any package that is used is recommended.
Relationship of MaxDiff to other techniques
MaxDiff can be viewed obtaining Incomplete Rankings and Partial Rankings. If a person is shown a list of Coke, Pepsi, Diet Coke and Coke Zero and indicates that Coke Zero is best and Coke is worst then the ranking obtained is: Coke Zero > Diet Coke = Pepsi > Coke.
Although the "max" and "diff" in "MaxDiff" are short for "Maximum Difference", MaxDiff as practiced in survey research is unrelated to Maximum Difference Scaling in psychophysical experiments (there is a conceptual relationship, but both the statistical models and the software developed for one are not readily adaptable to the other).[1]
MaxDiff can be viewed as a form of discrete choice experiment. Additionally, standard discrete choice models, such as the various generalizations of Multinomial Logit can be use to analyze MaxDiff experiments, although the resulting parameter estimates are biased.
Other resources
Information of a more technical information can be found by searching our blog and on the Sawtooth Software website.
References
- ↑ Kenneth Knoblauch, Laurence T. Maloney. (2008) “Kenneth Knoblauch, Laurence T. Maloney”. Journal of Statistical Software, Vol. 25, Issue 2, Mar 2008.
Pages in category "MaxDiff"
The following 11 pages are in this category, out of 11 total.

