Frequency Table
Jump to navigation
Jump to search
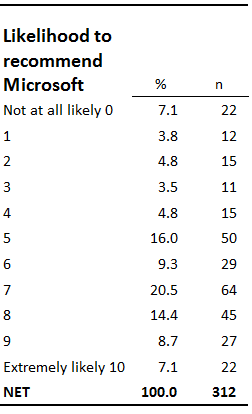
A table showing the number and proportion of observations in a sample in a specific category of a variable. For example, with data obtained by asking 312 people how likely they are to recommend Microsoft, the following frequency table was obtained:
