K-Means Cluster Analysis
k-Means cluster analysis is an algorithm for classifying observations (e.g., people) into clusters.
Step 1: Specify the number of clusters (k)
The first step in k-means is to specify the number of clusters, which is referred to as k. Traditionally researchers will conduct k-means multiple times, exploring different numbers of clusters (e.g., from 2 through 10).
Step 2: Allocate respondents to clusters
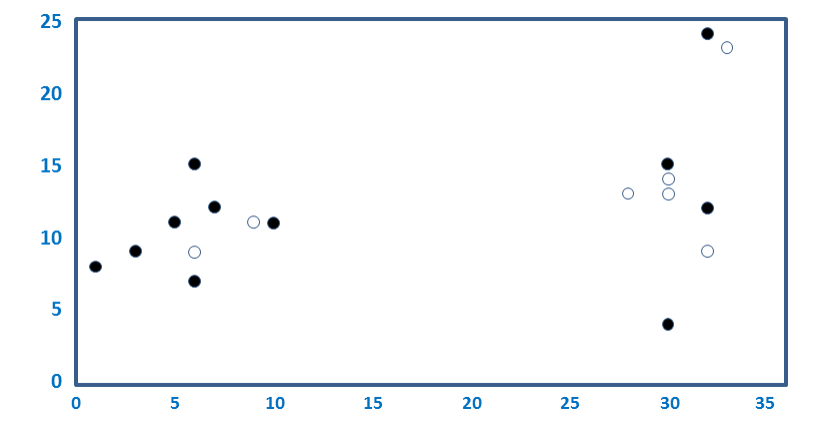
The most straightforward approach is to randomly assign observations to clusters, but there are many other approaches. In this example k has been specified as 2 and the respondents have been randomly assigned to the two clusters, where one cluster is shown with black dots and the other with white dots.
Step 3: Compute cluster means
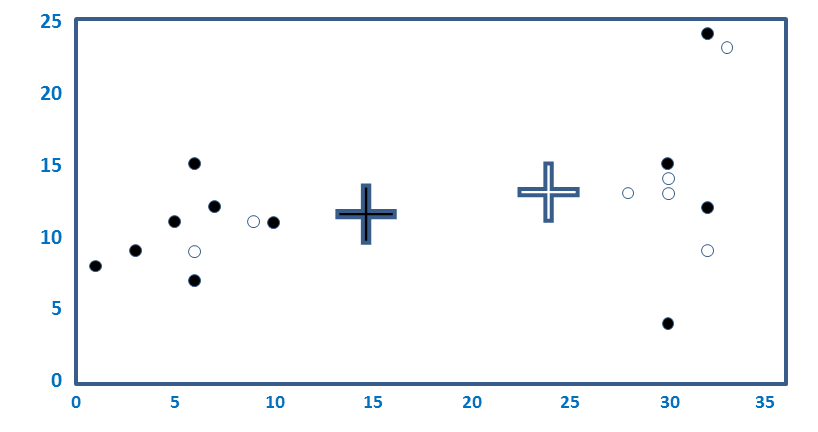
For each cluster the average value is computed for each of the variables. In the example below, the average value of the black dots on the variable represented by the horizontal position of the dots is around 15 and it is around 12 for on the vertical dimension. These two means are represented by the black cross. Or, stated slightly differently: the black cross is in the middle of the black dots. Similarly, the white cross is in the middle of the white dots.
Step 4: Allocate observations to the most similar clusters
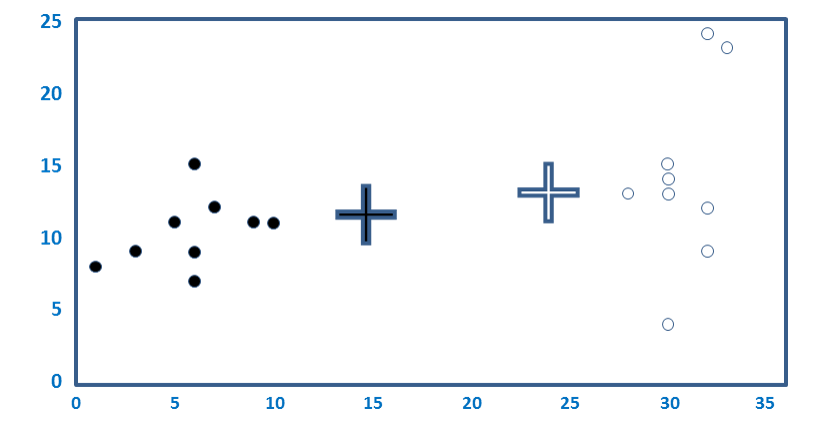
Looking at the plot above, it is clear that some of the black dots are closer to the white cross and some of the white dots are closer to the black cross. When we re-allocate the observations to the closest clusters we get:
Step 5: Repeat until the solution convergence
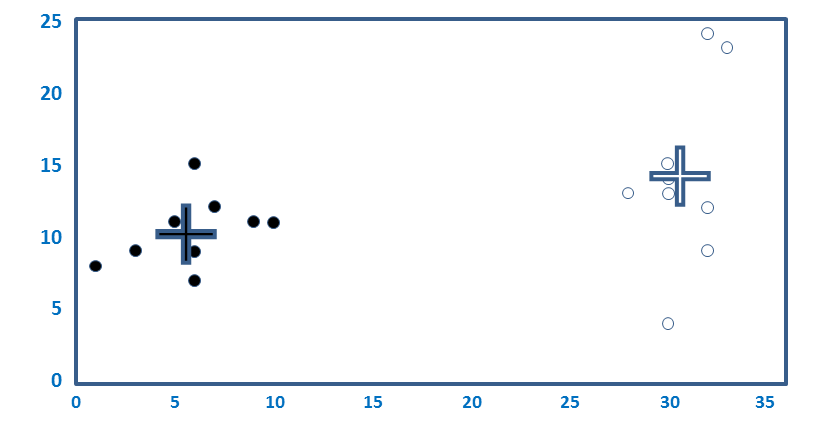
Looking at the plot above we can see that the crosses, which are the cluster means (also known as medoids and centroids) are no longer accurate. In the plot below they have been updated. In this example the cluster analysis has converged (i.e., re-allocating observations and updating means cannot improve the solution). In examples with more data typically a few more iterations are required (i.e., the steps 3 and 4 are repeated until no respondents change clusters).
Variations of the k-means algorithm
There are a number of different k-means algorithms. The one described above is known as the batch algorithm and is the default in SPSS [note 1]. Common variants of this algorithms are:
- Rather than allocating all of the respondents to the most similar cluster, instead allocate the first respondent to the most similar cluster, then update the means, then allocate the second respondent to the most similar cluster, then update the means, etc.
- Repeating the whole process hundreds or thousands of times, each time with a initial random allocation, and selecting the final solution as the one with the smallest average distance between each respondent and their nearest cluster.
Notes
Template:Reflist
Cite error: <ref> tags exist for a group named "note", but no corresponding <references group="note"/> tag was found


