Stacked Data
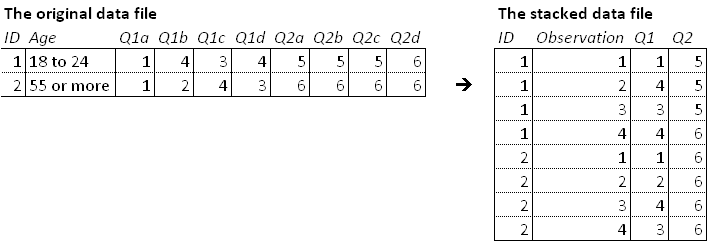
A data file is 'stacked' when a single respondent’s data appears as multiple cases (i.e., multiple rows in a data file). Most commonly, this is because the respondent has provided data about multiple occasions (where each occasion is in a separate line) or about all the members of their household (where each household member is in a separate line).

Common reasons for stacking data
Typically, stacking is used to make calculation of summary statistics, such as averages, and percentages, more straightforward. In the example above, most statistical programs would not readily be able to compute an average answer to Q1 using the original data file, but can easily do so using the stacked data file.
Stacked data and statistical significance
Stacking the data from variables in a data set has the consequence of inflating the sample size (e.g., 100 respondents with 10 rows of data become 1,000 observations). This can cause problems with statistical tests. This can be partially ameliorated by using a weight (e.g., in this example, assigning each observation a weight of 0.1), although this is a hack. It is better to either treat the data as hierarchical in a modeling sense (e.g., fitting some kind of Bayesian model), or, treat the data as being from a cluster sample.