Banner
Market researchers commonly use banner tables to show results that are broken down by several key pieces of information at the same time. For example, a banner table may display brand awareness across several demographics, like Age, Gender, and Region, so that all of those key breakdowns may be viewed at a glance.
In Displayr, a Banner is a special type of Variable Set which is used to bring together categories from many distinct Variable Sets. The banner is not fixed to a particular table - you can use and reuse the banner on as many tables as you like (as you would with any variable set).
The basic process for setting up banner tables in Displayr is:
- create your banner by choosing the variable sets that you want to combine
- select the banner as the variable set that you select in the Columns section of a table (you can also use it for the Rows).
How to create a new banner
To create a new Banner in Displayr:
- In the Data Sets tree, select a variable set and then hover the mouse where you want to insert the banner and click the + > Banner.
- A banner will be created and the Object Inspector will show BANNER settings. Here, you can choose the layout of your banner.
- Drag additional variable sets from the Data Sets tree into the BANNER section.
How to lay out a banner
When you select the banner under Data Sets, the BANNER section will become available in the Object Inspector on the right-hand side of the window. This is where you can choose the layout of your banner.
Tip: If you create a table on your page (Insert > Table) and place the banner in either the Rows or Columns section under Inputs > DATA SOURCE in the Object Inspector, then you will be able to see the banner update in real time as you change the layout.
Many configurations of banners are possible, but there are two basic arrangements.
Side-by-side
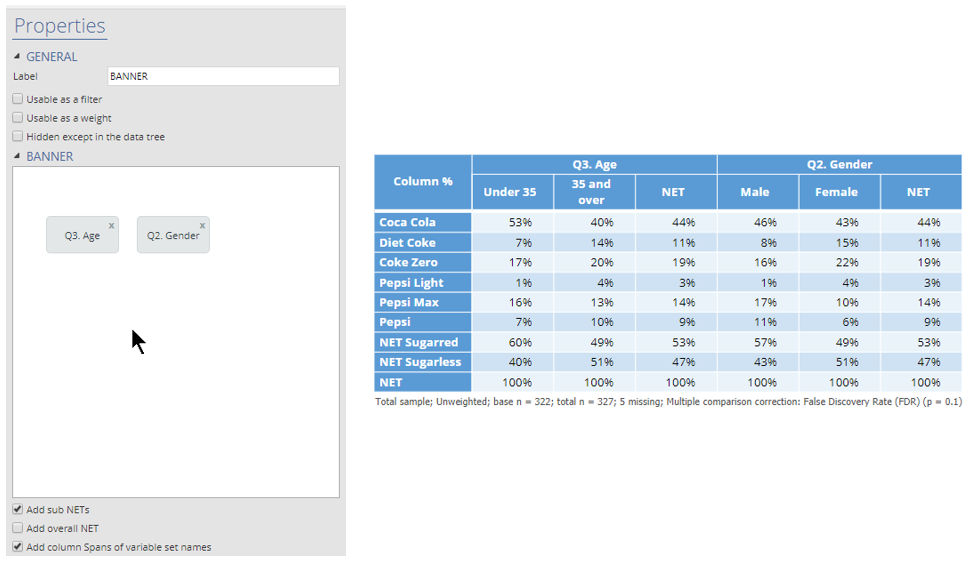
When two variable sets are placed next to one another, all of the categories will be displayed next to one another in the banner.
Top-to-bottom
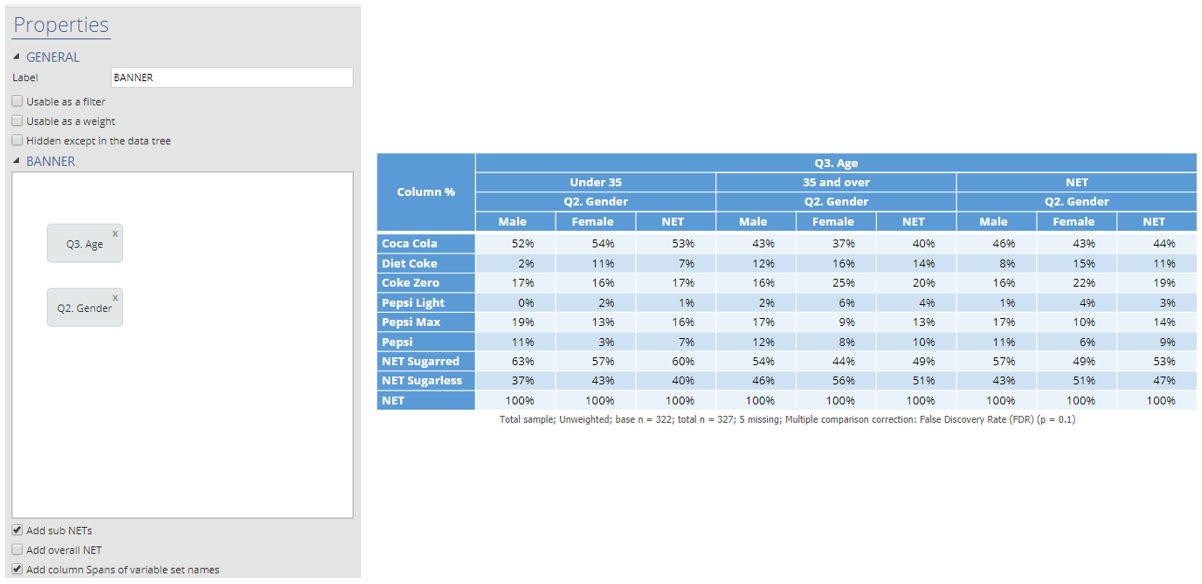
When two variable sets are placed on top of one another, the categories of the lower variable set will be nested within each of the categories of the upper one.
When more than two variable sets are used in a banner you may have many possible orientations.
Banner options
Three additional settings are available for choosing the appearance of your banner:
- Add sub NETs determines whether NET columns are included for each variable set.
- Add overall NET determines whether a NET column is included at the end of the banner.
- Add column span of variable set names determines whether the names of the variable sets are included as additional column headers which span the columns.
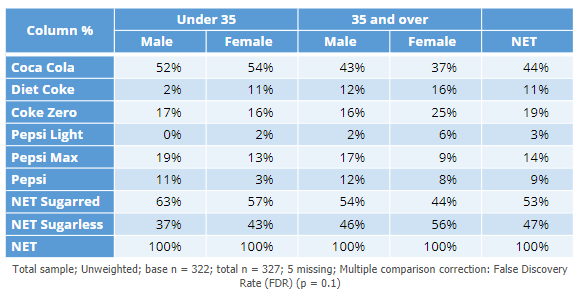
In this example, the subnets and spans have been removed, leading to a more stream-lined table, and an overall NET has been included on the right-hand side. Note: the NET may be slightly different to an overall sample 'Total'.
How to edit a banner
If you want to change the way your banner is arranged you can:
- Select the Banner variable set under Data Sets and then use the options on the right of the screen in the Object Inspector (as above) to make changes.
- Use the options in the Data Manipulation section of the ribbon to merge, delete, and rename categories.


