Creating a Banner
A banner traditionally refers to different demographic data that is combined and presented in the columns of a table. A simple banner may contain Age and Gender categories, side by side. A more complex banner may nest categories, so that Gender is repeated for each Age category.
Below are examples of how to create the two types of banners, using Displayr's built-in Demo Data:
Simple Banner: Age and Gender
Create a new variable for each age and gender category
1. Go to Anything > Data > Variables > New > Custom Code > JavaScript - Numeric
2. Enter the following into the box JAVASCRIPT CODE under Properties:
Age == 2
3. Enter the name (e.g. "18 to 24") under Properties > GENERAL > Label, and a short variable reference name under Properties > GENERAL > Name. Keep in mind, variable Names cannot contain special symbols or spaces.
4. Repeat steps 1-3, replacing the JavaScript formula and name for the following:
| JavaScript | Name |
|---|---|
| Age == 3 | 25 to 29 |
| Age == 4 | 30 to 34 |
| Age == 5 | 35 to 39 |
| Age == 6 | 40 to 44 |
| Age == 7 | 45 to 49 |
| Age == 8 | 50 to 54 |
| Age == 9 | 55 to 64 |
| Age == 10 | 65 or more |
| gender == 1 | Male |
| gender == 2 | Female |
Combine the new variables into one
1. Select all of the new variables under Data Sets, by holding CTRL or SHIFT.
2. Click Anything > Combine
3. Click Properties > GENERAL > Label and change the label to Banner.
Change the data to percentages
1. Properties > GENERAL > Structure > Binary - Multi
2. In the Values to Count box, ensure that 1 is checked.
3. Click OK.
View the new banner
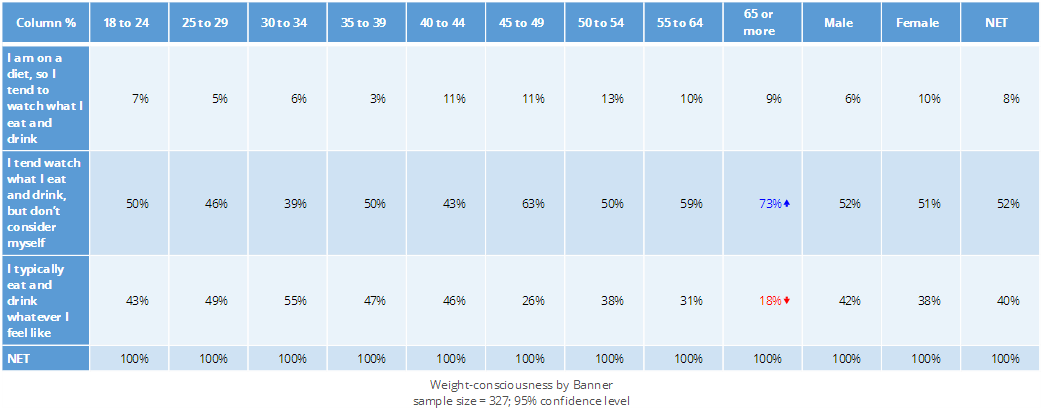
1. Drag the Variable set called called Weight-consciousness from under Data Sets onto the page and click on the resulting table.
2. Click the Inputs > DATA SOURCE > Columns dropdown.
3. In the list that appears, select Banner.
4. You should now see the banner in the columns of the table.
5. In this example, the banner makes the table quite wide, so to make it fit on the page, we shrink the font size to 8. using Properties > Appearance > Font.
Complex Banner: Gender nested under Age
The process for complex banners is the same as for simple banners, except that the JavaScript and names are different. Use the following JavaScript and names in the Demo Data to achieve a nested banner.
| JavaScript | Name |
|---|---|
| Age == 2 && gender == 1 | 18 to 24, Male |
| Age == 2 && gender == 2 | 18 to 24, Female |
| Age == 3 && gender == 1 | 25 to 29, Male |
| Age == 3 && gender == 2 | 25 to 29, Female |
| Age == 4 && gender == 1 | 30 to 34, Male |
| Age == 4 && gender == 2 | 30 to 34, Female |
| Age == 5 && gender == 1 | 35 to 39, Male |
| Age == 5 && gender == 2 | 35 to 39, Female |
| Age == 6 && gender == 1 | 40 to 44, Male |
| Age == 6 && gender == 2 | 40 to 44, Female |
| Age == 7 && gender == 1 | 45 to 49, Male |
| Age == 7 && gender == 2 | 45 to 49, Female |
| Age == 8 && gender == 1 | 50 to 54, Male |
| Age == 8 && gender == 2 | 50 to 54, Female |
| Age == 9 && gender == 1 | 55 to 64, Male |
| Age == 9 && gender == 2 | 55 to 64, Female |
| Age == 10 && gender == 1 | 65 or more, Male |
| Age == 10 && gender == 2 | 65 or more, Female |
However, be warned, this will make a very wide table! For both readability and presentation purposes, it makes more sense to combine the Age categories into subcategories, as in the below banner.
| JavaScript | Name |
|---|---|
| (Age == 2 || Age == 3 || Age == 4 || Age == 5) && gender == 1 | Under 40, Male |
| (Age == 2 || Age == 3 || Age == 4 || Age == 5) && gender == 2 | Under 40, Female |
| (Age == 6 || Age == 7 || Age == 8 || Age == 9 || Age == 10) && gender == 1 | 40 and over, Male |
| (Age == 6 || Age == 7 || Age == 8 || Age == 9 || Age == 10) && gender == 2 | 40 and over, Female |
