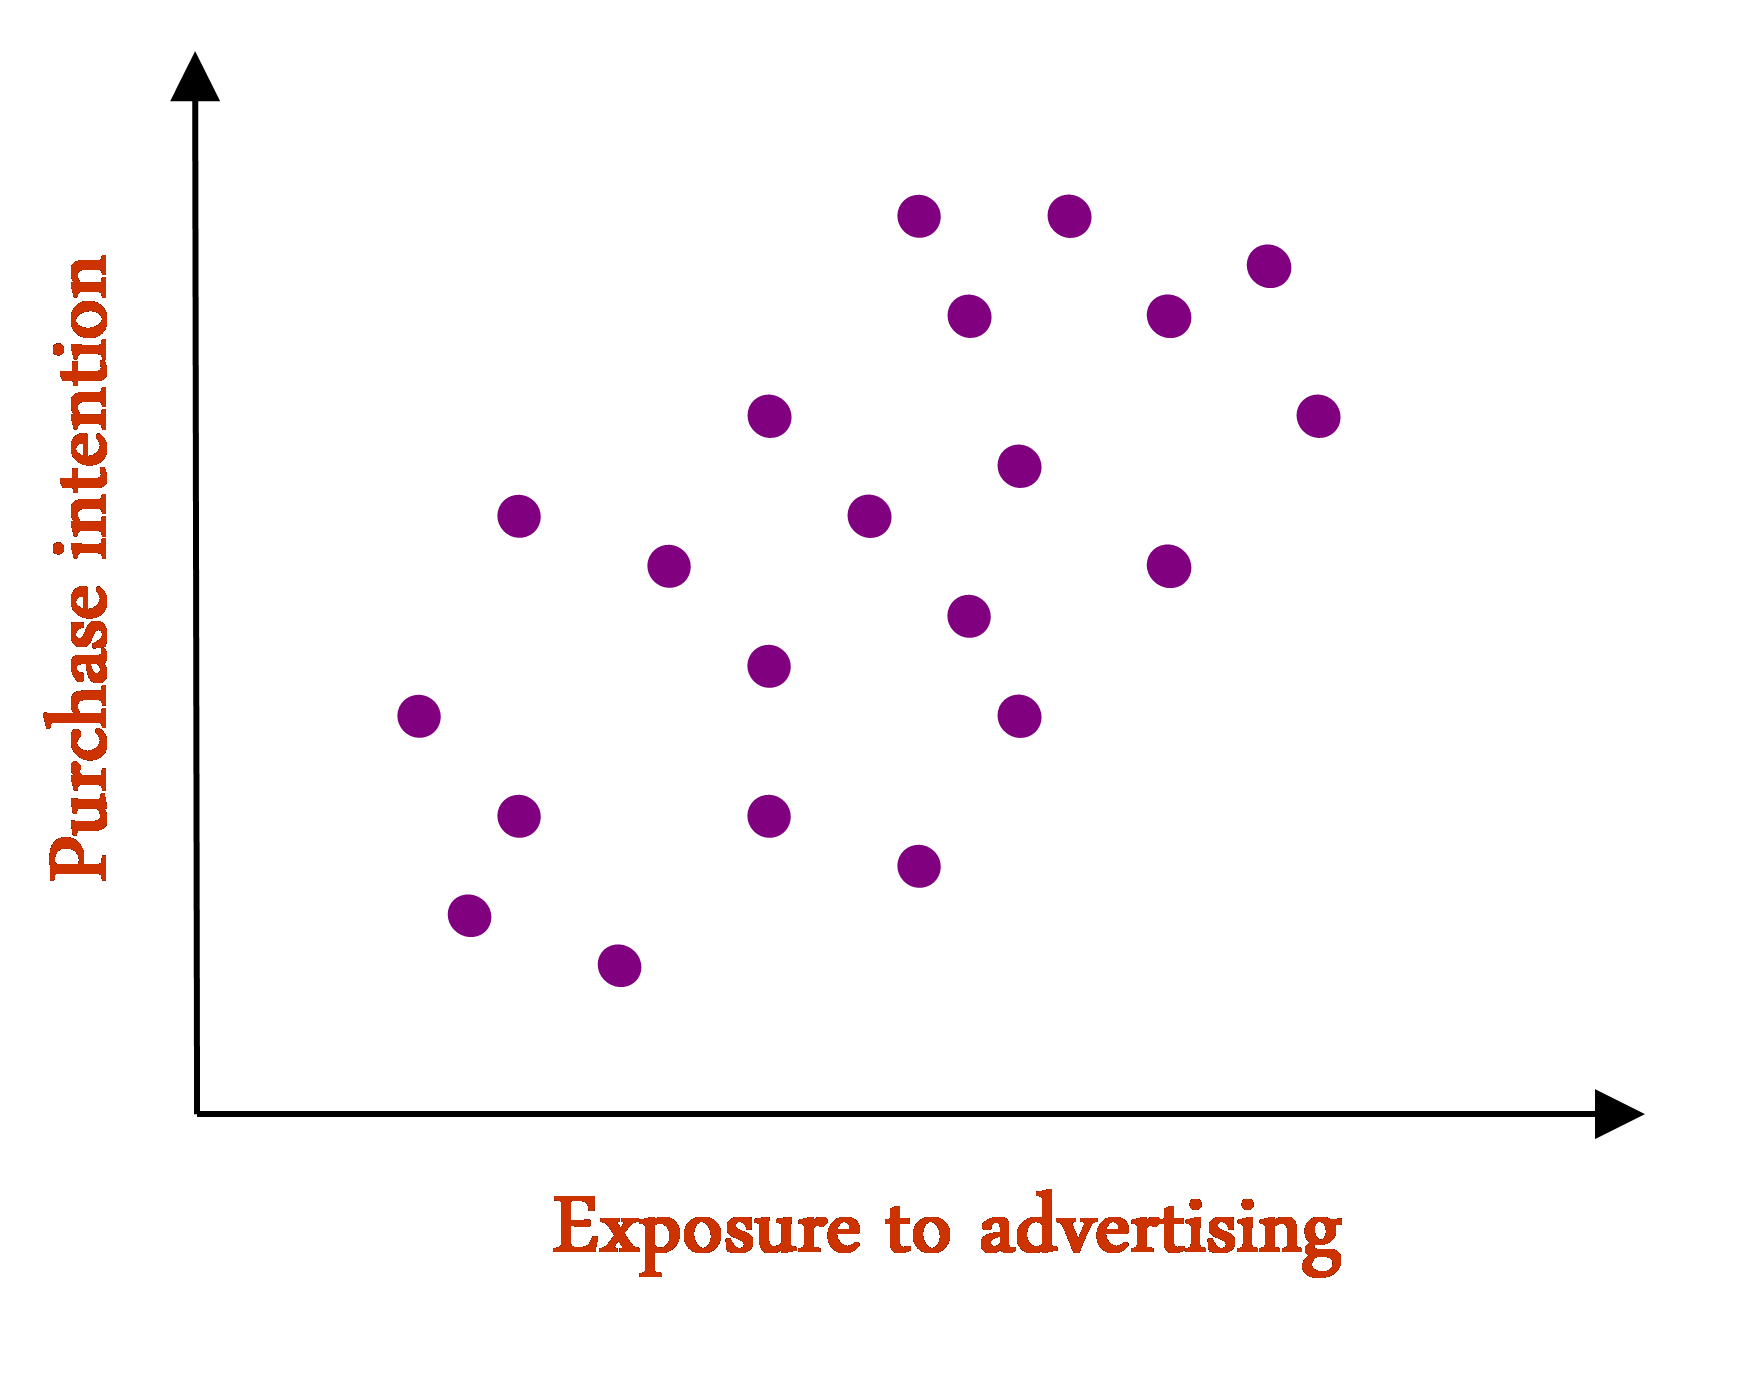
Scatterplot
Jump to navigation
Jump to search
A scatterplot is a graph that plots the values of two variables, where the value of each observation on one variable is shown by its horizontal position and its value on the other variable is shown by its vertical position. This blog post describes how to create a scatterplot in Displayr. You can also create a small multiples (panel chart) version.
Examples
More examples of Scatterplots with different types of input can be found here
