Comparing differences between columns
Jump to navigation
Jump to search
Where you have a table where the columns represent different categories (e.g., different ages), you can present statistical tests comparing the results of each row between the columns by selecting:
- Object Inspector > Inputs > STATISTICS > Statistics - Cells > Column Comparisons, and,
- Object Inspector > Inputs > STATISTICS > Statistics - Bellow > Column Names.
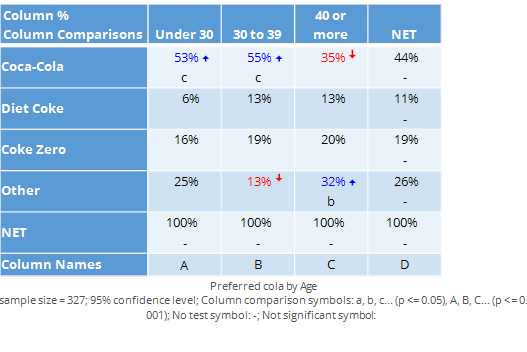
The results of the statistical tests are shown by letters, as shown in the example below.
The letters are interpreted as follows:
- The letters at the base of the table indicate the names of the columns (i.e., in this case: A, B, C and D).
- Where letters appear in a cell this indicates that the result in that cell is higher than the comparable result in the same row for the column represented by the letter. For example, the letter "c" that appears for Coca-Cola by Under 30 indicates that the 53% preference for Coca-Cola among people aged less than 30 is significantly higher than the value of 35% among people aged 40 or more (i.e., column c). Similar,we can see that the preference for Coca-Cola among 30 to 39 year olds is significantly higher than the preference among people aged 40 or more, and, we can see that the preference for Other among people aged 40 or more is significantly higher than the preference for Other among people aged 30 to 39.
- The absence of column letters is also informative. No letters are shown on the Coke Zero row and thus statistical testing does not suggest the existence of differences in preference for Coke Zero among the shown age groups (for this sample of data).
- By default, letters that are significant at the 99.9% confidence level (i.e., p <= 0.001) are represented by capitals and letters between the 95% and 99.9% level of confidence are represented by lowercase letters). In the table above, all the results are significant at between the 95% and 99.9% level of significance.