Correlation
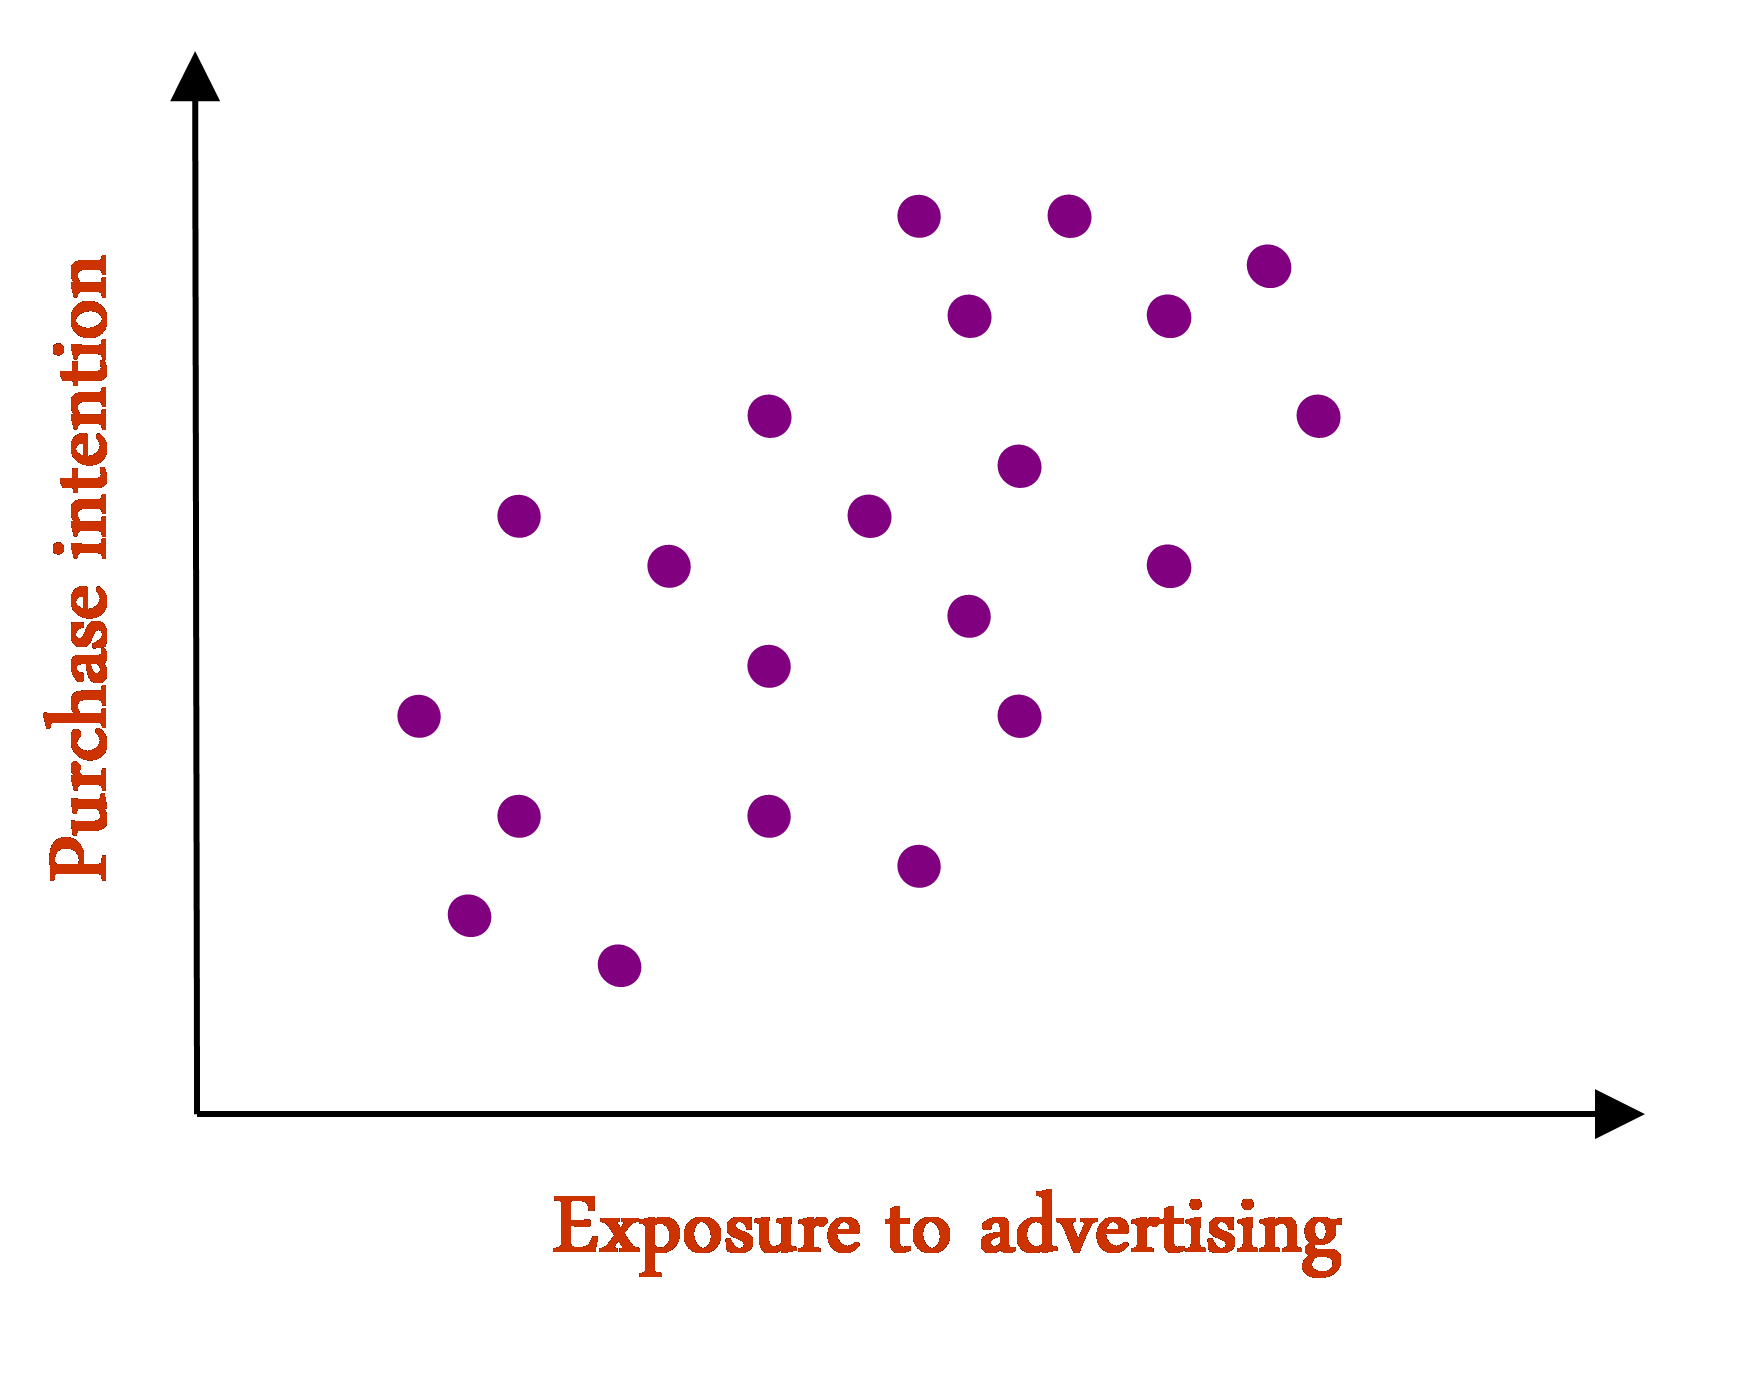
The extent to which two variables are interrelated. Where higher levels of one variable are more likely to occur with higher levels of another variable, the two variables are said to be correlated (or, positively correlated). Where higher levels of one variables are more likely to occur with lower levels of another variable, the two variables are negatively correlated.
A weak positive correlation is one where the relationship is weaker, such as shown in the following scatterplot:
A perfect negative correlation is one where the lines slope down, where “perfect” means that you can draw a straight line exactly through all the dots:
File:PerfectNegativeCorrelation.png
Sometimes it can be a bit too vague to describe a correlation as being weak or strong and it is useful to assign a number indicating the strength of the correlation. There are lots of different ways of computing such numbers, but the most widely used is Pearson's Product-Moment Correlation, which is often referred to simply as “correlation”.
Categorical data
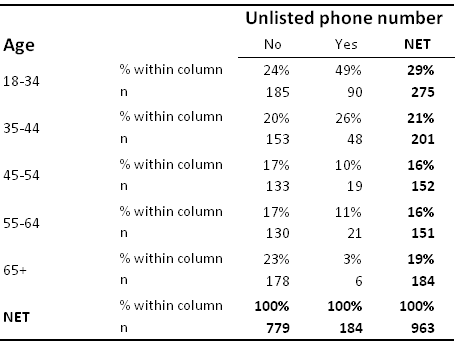
Where the data is categorical the basic idea of correlation is still applicable (although some researchers prefer to use terms like association when describing categorical data). In the table below, as an example, the age distribution (i.e., pattern) for people without unlisted numbers is different to that for people with unlisted numbers. That is, the crosstab clearly reveals a relationship between the two. Thus, we can also say that these the variables used to create this table are correlated. If there was no relationship between these two categorical variables, we would say that they were not correlated.

