Pearson's Product-Moment Correlation
Jump to navigation
Jump to search
The standard statistic used to quantify a correlation. It is commonly represented as r.
It is interpreted as follows:
- An r of 1 indicates a perfect positive correlation.
- An r of -1 indicates a perfect negative correlation.
- An r of 0 indicates that there is no relationship between the different variables.
- The closer r is to 0, the weaker the correlation (and, equivalently, the further r is from 0 the stronger the correlation.
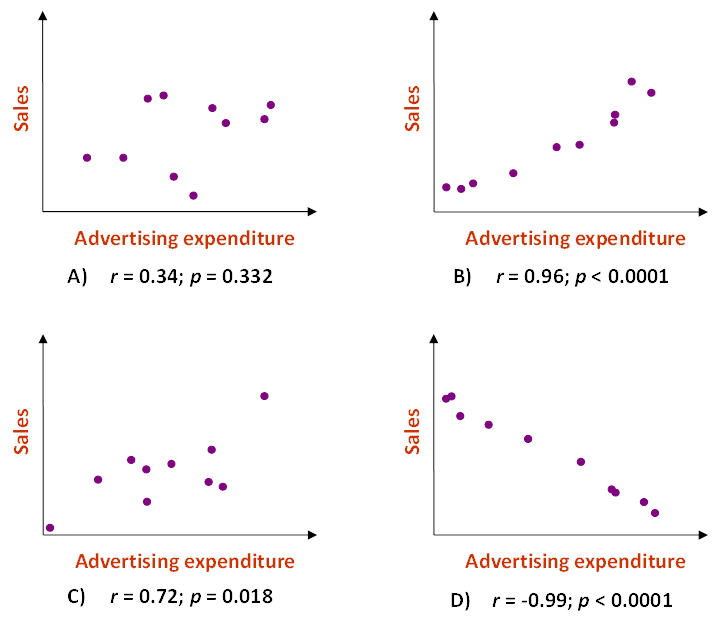
The following scatterplots show examples of Pearson's Product-Moment Correlation and associated p-Values.
